Introduction
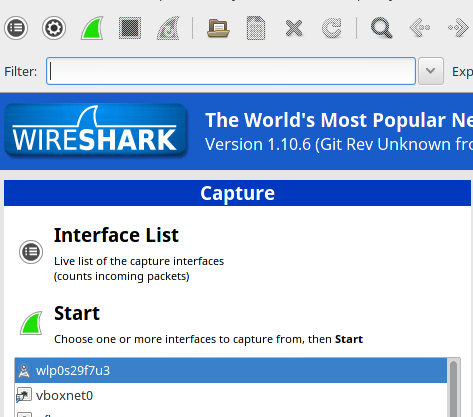
The home interface of wireshark looks like shown below. Using wireshark we can easily trace what is happening in the network. Wireshark basically snoops your network interface to see what data bits is going through and interprets into meaningful protocols.
Here are some examples people use Wireshark for:
- network administrators use it to troubleshoot network problems
- network security engineers use it to examine security problems
- developers use it to debug protocol implementations
- people use it to learn network protocol internals
Beside these examples, Wireshark can be
helpful in many other situations too.
The main window is divided into list
pane(above), details pane(below) and bytes pane(right) as shown in
figure
- The packet list pane displays a summary of each packet captured. By clicking on packets in this pane you control what is displayed in the other two panes.
- The packet details pane displays the packet selected in the packet list pane in more detail.
- The packet bytes pane displays the data from the packet selected in the packet list pane, and highlights the field selected in the packet details pane.
This completes introduction to
wireshark. Now it is time to see some protocols in action.
1.Ping:
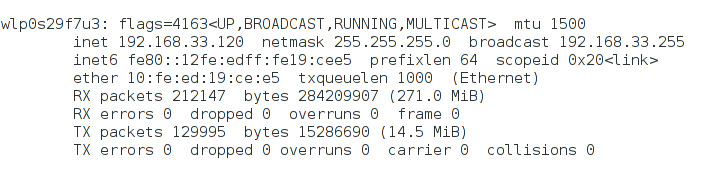
Ping like any other network tools can be easily traced using wireshark. Below is my network interface configuration. It is a wireless adapter with dynamically allocated IP 192.168.33.120
1) Start with ping 8.8.8.8 (gooogle dns)

2) Now click the green start button after choosing your current network interface.
3) Wireshark starts tracing the packets once you start it. It is recommended to start wireshark before using any network tools so that you don't miss needed packets. Type icmp in the filter box to see only ping packets.

2. Trace Route:
Traceroute helps to find the path taken
by the packet to reach the destination. The main field to note here
is the TTL which determines how many hops are needed to reach the
destination.
1) Now click the green start button after choosing your current network interface.

2) Type traceroute
8.8.8.8 in linux and trroute
8.8.8.8 in windows

3) Above is shown path to
8.8.8.8 which takes around 12 hops to reach destination. The
wireshark trace is shown
below. Here you can see TTL to be 5. Three packets for each TTL is
recorded and shown here.

3. WGET:
Wget is a tool used to fetch a
web page using CLI instead of a web browser. Here
am going to shown trace while fetching www.google.com
1) Click the green start button after choosing your current network interface.

1) Click the green start button after choosing your current network interface.
2) Type
wget www.google.com
in terminal. Make sure you have already installed the wget package.
An HTTP request is sent and
a response index.html.1 is received back.

3) Shown below a typical TCP three way handshake Request-Response-Ack for connection establishment.

4) DHCP:
DHCP
server allocates IP address dynamically whenever new host joins it's
network. Trace of DHCP
server 172.16.28.1
allocating IP address 172.16.29.195
is shown
where DORA procedure takes place.

5) ARP:
Here using the same trace we can see network configuration protocol
like ARP in action. ARP is used to find the mac address when IP
address of the destination is known. Just type arp
in filter box to see only arp packets.

6) DNS: Domain
name service is used to find the IP address given a URL eg:
www.google.com >
74.125.200.104. Trace shown below with
Queries and answers of
www.google.com.
Type
DNS to
see only dns packets

No comments:
Post a Comment